
Comparative Analysis of Text Prediction in Gmail and Outlook
The use of communication tools like chat and email to complete daily activities is becoming more and more crucial. Time can be saved and productivity increased with accurate real-time phrase completion. There are 3.8 billion email subscribers worldwide, and each day they send an average of 281 billion emails. Email remains the main form of contact at work, and this email client market is led by Gmail and Outlook, two of the most successful email providers globally. By facilitating message authoring, autosuggestion systems aim to reduce human workload and save time. The technology of predictive text is not new. T9 (Text on 9 keys), which enables words to be created from just a single keystroke for each letter, was one of the earliest widely used versions and became a standard on several cell phones throughout the late ’90s. The goal of T9 is to make text message input simpler. The sophistication and scope of autosuggestion tools, however, have increased dramatically because of the development of more advanced, scalable AI techniques in language. However, just like any other technology, even the most powerful autosuggestion systems are prone to bugs that appear during the development and deployment processes. As ML approaches and natural language processing approaches have the tendency to adapt over time to a user’s word choice, auto-correct in the present day uses a combination of both. Currently, there are systems that employ neural network models, language models, and NLP, and systems that employ neural network learning and database alterations to achieve predictive text. Although autocorrect is frequently used to correct a single word, autocomplete is designed to complete sentences and phrases. Both autocorrect and autocomplete technologies employ deep learning methods that are extremely similar. Using neural networks, Smart Compose, the autocomplete feature in Gmail, and Text Prediction, the autocomplete feature in Outlook, can suggest ways for users to finish words, sentences, phrases, and subjects. It is believed that Gmail’s Smart Compose improves a user’s email-typing efficiency. So, the goal of this study is to put Gmail’s Smart Compose and outlook’s autocomplete to the test using human evaluation.
Gmails Smart Compose
Before introducing Smart Compose, Gmail offered Smart Reply, which follows a similar methodology and provides users with three simplified potential replies as “shortcuts” that may be chosen with a single click. However, each technology uses very similar deep-learning techniques. Emails that would often take minutes to write out can be promptly responded to using Google’s Smart feature. However, the AI powering these technologies contains flaws that could create prejudices or adversely affect the overall language used in communicating.
The AI model behind Smart Compose, which processes in the cloud on specialised accelerator hardware, was developed using billions of instances of emails. Smart Compose was introduced in 2018. The “hierarchical approach” to suggestions used by Smart Reply, which laid the foundations for Smart Compose, was motivated by how people comprehend concepts and languages. Smart compose relies on features like the previous message header, mail subject, date/time, location, etc. are generated once and appended to the token word embedding, which is supplied each time in the subsequent steps. Each completed prefix token, including the previously hidden output, is sent to the language model. This effort can frequently be avoided by using caches from earlier queries. Because of this, the cost of prefix encoding frequently changes depending on how much input the user has provided.
Outlooks Text Prediction
Simple tools like autocorrect, which was first introduced in Microsoft Word in the 1990s eventually became a common messaging tool on mobile phones. Microsoft Teams and Outlook both received the suggested replies feature in 2018, which is a functionality very similar to smart compose. Outlook’s new Text Predictions feature released in 2021, might help you write emails more quickly and efficiently. For those who frequently send emails, Outlook’s Text Predictions feature offers suggestions as you type. Using this feature will save you time and effort.
Experimental Design
In this section, the process in which this research was carried out will be highlighted, also capturing how it was carried out in a controlled and objective fashion.
The essence of this project is to establish a comparative analysis of the predictions that Google Gmail and Microsoft Outlook’s email services suggest when a person is composing an email. Suggestion helps to shorten the time it takes to gather one’s thoughts and also shorten the time it will take to compose an email.
What subjects will you recruit? How many, and where will you get them?
The subjects of this research will be family and friends. The essence of involving them is to ensure that the data that they will provide are accurate. It is a lot easier to instil in them the importance of accurate data, which will enable us to have good results during our analysis of these systems. To get enough data to make this analysis, it was desired that 50 subjects will be recruited for this research. The data won’t be made public to preserve privacy of participants.
What will you ask subjects to do? If you use specific scenarios, what are they?
Our subjects are also to make sure Smart Compose and Autocorrect are turned on Gmail and Outlook, respectively. We urge them not to specify a subject for the mail and leave that blank until they are done composing the mail to see if the system can suggest the subject of the mail from the body of the email. There are 5 topics from which we would request our subject to select one and write an email in both Gmail and Outlook that will be 80 to 100 words long.
One of the most important things we ask our subjects to do is to give their consent to take part in this research. Another essential factor in the success of this project is that our subjects are not to copy and paste emails. We are aware that these systems are different, and they may suggest different things even if the text is in the same context and even similar. We desire to have them collect the suggestions they saw while composing the emails, noting the number of suggestions the systems generated and the number of suggestions they accepted.
What will you measure?
We intend to get the gender, age, a number of suggestions gotten, number of suggestions accepted, screenshots of the emails the subjects composed, and a Likert scale asking the subjects to rate their experience with these systems. We would like to note the correlation between gender and age to the preferences in the system.
Research Questions
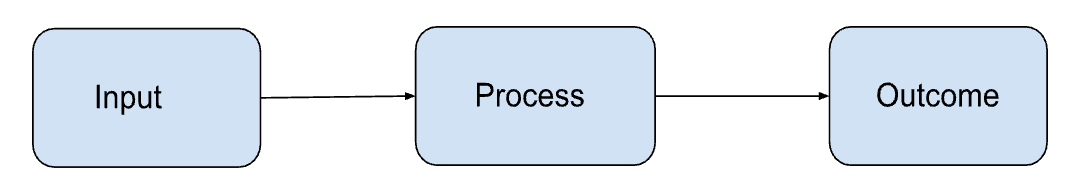
An effective evaluation is built on the research questions chosen. They specify which subjects need to be assessed for evaluating any particular system. Not only does this save money and time, but it also facilitates what information is required, how to analyse it and how to report it. Research questions are essential to make the reader understand the importance of the topic being studied. They outline how to proceed, point out and concentrate on the research gaps. The goal of this evaluation is to create a comparative analysis of the email predictions made by Google and Outlook when a user is composing an email. Before designing the research questions, we need to develop a logic model to make the program design clear. It conveys the expected connections between the systems’ different elements. The logic model consists of inputs, processes and the outcomes that are expected from the processes. The model that is represented by these parameters should be tested through research questions.
Research questions are a list of questions to be answered at the end of the evaluation. It should be clear, specific, well defined and should be aligned with the logic model. For evaluating the smart compose and autocomplete of Gmail and outlook respectively, we have designed 7 different questions which will measure the performance of the system.
Is there a statistically significant difference between the number of suggestions given out by Text Prediction in Gmail and Outlook?
Both systems have their own text prediction algorithm which automatically completes sentences while composing an email. However, we can presume that Gmail has a better text prediction compared to the latter mainly because the autocomplete feature in outlook was developed not long ago. The more user data the system gets exposed to, the better the results will be. Gmail’s smart compose feature was rolled out to mobile devices whereas outlook released the autocomplete feature for the web recently. Even though Smart compose had more data to be trained on, there is no significant difference between the two as the text prediction systems work similarly. Still, we can presume that Gmail is better when it comes to suggestions for the reason that it has a huge database.
Is there a statistically significant difference between the number of suggestions accepted by people when using Text Prediction in Gmail and Outlook?
When it comes to choosing one over another, people are biased towards the more popular option. If we take a look at the statistics, we can clearly see that Gmail is preferred by around 27% of people and outlook by a little over 4%. People tend to accept more suggestions from Gmail than Outlook just because the system is more popular and people can rely on the suggestions. Outlook might provide the same number of suggestions as Gmail does, but it won’t be accurate enough or related to the subject in which the email is composed. However, we don’t have enough data to conclude there is a significant difference in the suggestions accepted between Gmail and outlook.
Can one system predict email subjects better than the other?
Unless and until the body of the email is not clear, the systems find it difficult to predict the subject of the email. Gmail’s algorithm has a better way of understanding the content which is evident from its suggestions. The outlook predicts the subjects very occasionally as the content needs to be very clear. Here we can presume that Gmail predicts email subjects better than outlook.
Does age play a factor in preferring one system over another?
In this aspect, age can be considered as an influential factor for preference between two systems. With respect to different age groups, the usage of both platforms differs on different lines. If we consider Gmail to begin with, the most susceptible population to use it is the youth (15–24 years) and adults (25–64). While it is more common with these age groups, it is also essential to consider what kind of population will prefer using which platform more. In the case of Outlook, the prominence of its usage can be inclined more towards the working population in the majority of the professional sectors as compared to Gmail. Likewise, Gmail is a preference for almost all age groups who can have access to its usage in today’s life. While on one hand it can be estimated that the youth population would be using both systems almost equally since students are substantially covered under this population and universities are expected to operate and communicate considerably through this system. The age group of the population that strikes out in terms of usage of both platforms will noticeably be children(1–14) and seniors(65 and above).
Does gender play a factor in preferring one system over another?
With respect to gender as a parameter, its influence on the preference of Gmail and Outlook is uncertain. However, this aspect will draw on the accessibility to both systems. The scope for comparison would be dimmed but it can assist in comprehending identities represented in both systems. Delving into gender will also allow us to note the structure of the age groups as a factor in this context. Along with that, gender also aids in understanding the personalization of the content developed through both the systems as in the usage of pronouns could be an example.
Is there a correlation between the preference for one system and the number of suggestions given/accepted in emails?
Preference for a system is mostly related to how user-friendly, secure and feature-rich the system is. In this case, we are mainly focussing on how preference is based on the suggestions given and accepted by the user. As the suggestions predicted by the system become more accurate, the user will have to put less effort while composing an email. When the predictions are accurate, the number of accepted counts will also increase which in turn affects the preference of the system. Here we can conclude the preference is related to the suggestions given and accepted while composing emails.
Which system is preferred as the better system overall?
As mentioned in the previous question, preference can depend on the user experience, security and the features available. Gmail handles the organisation much better for example: how it filters the messages into three different inboxes based on the type. However, the outlook is more secure compared to Gmail, but when it comes to ease of use and productivity Gmail has the edge. Also in terms of features available including text prediction, Gmail has an upper hand. We will conduct the experiment and collect data from random people to evaluate the system more deeply.
Analysis
Data Cleaning
The first thing we did for cleaning the data was to rename the columns into something we could easily perform calculations on. The code to do that is shown below.
data = data.rename(columns={"How many suggestions were given out by Gmail's Smart Compose while writing your email? (Please specify the number of times suggestions were given out)": 'gmail_given', "How many suggestions were accepted while writing your email? (Please specify the number of times suggestions were accepted)": "gmail_accepted", "Please specify your gender? (You can opt out of this question if you want)": "gender", "Please specify your age? (You can opt out of this question if you want)": "age", "Choose any one scenario to write an email in Gmail and Outlook.": "topic", "Did Gmail's Smart Compose predict the subject correctly based on the emails body?": "gmail_subject", "How many suggestions were given out by Outlook's Autocomplete while writing your email? (Please specify the number of times suggestions were given out)": "outlook_given", "How many suggestions were accepted while writing your email? (Please specify the number of times suggestions were accepted).1": "outlook_accepted", "Did Outlook's Autocomplete predict the subject correctly based on the emails body?": "outlook_subject", "Rate your experience about using Gmails Smart compose and Outlooks Autocomplete. [Gmail]": "likert_gmail", "Rate your experience about using Gmails Smart compose and Outlooks Autocomplete. [Outlook]": "likert_outlook"})
We also removed the columns where the number of suggestions accepted is more than the number of suggestions given out. This helps us discard incorrect survey entries.
# Gmail
data = data[data["gmail_given"] >= data['gmail_accepted']]
# Outlook
data = data[data["outlook_given"] >= data["outlook_accepted"]]
Data Visualization
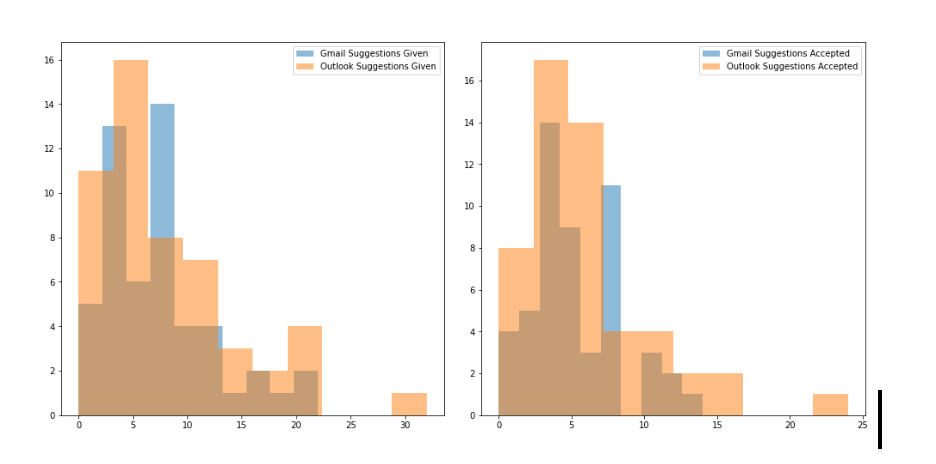
Distribution of the number of suggestions given out vs the number of accepted suggestions
**Figure 2 **shows the plot distribution of the number suggestions given out by Gmail and Outlook compared to the number of suggestions accepted by the subjects.
As we can see from the figure, Outlook’s frequency of suggestions given as well as the frequency of suggestions accepted is more than that of Gmail.
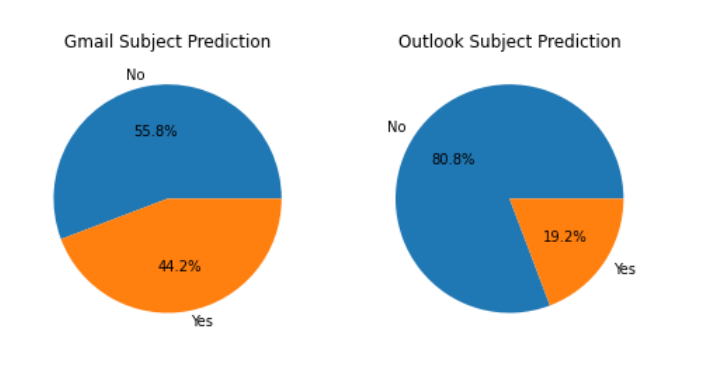
Subject Prediction by Gmail vs Outlook
The pie chart below clearly shows that Gmail is better at predicting subjects than Outlook. Gmail predicted the subject successfully 44.2% of the time compared to Outlook’s 19.2%.
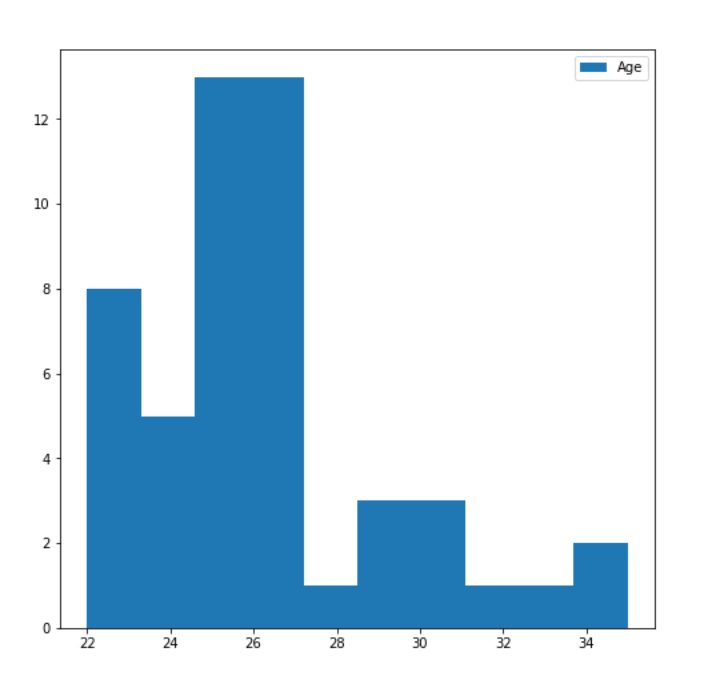
Range of age of the subjects
As we can see from **Figure 4 **the age of our subjects vary from 22 to 34, which prevents us from making any accurate statistical analysis about the preference of a particular system based upon the age of the subject.
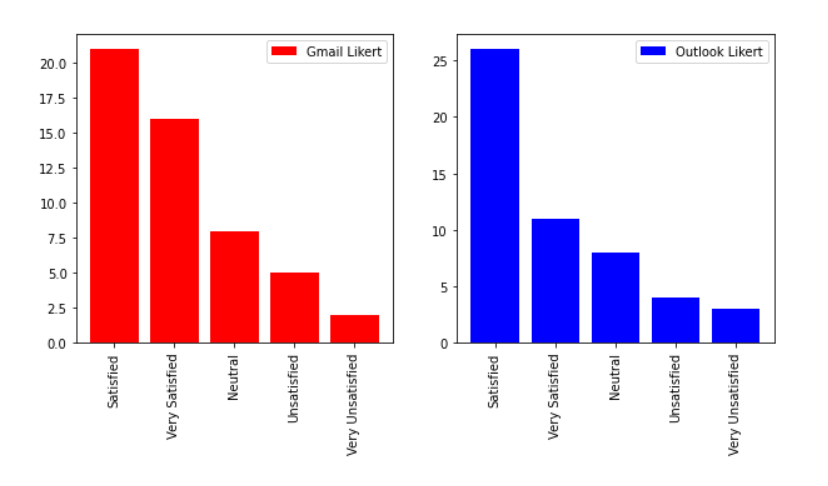
Vertical bar chart of the Likert scale
**Figure 5 **shows us the distribution of values of the Likert scale in preferring one system over another. As we can see, the positive values for Gmail edge ahead of Outlook by a small margin. If it’s Statistically significant or not, we will know about that in the next section.
Relation between the topic for email and the number of predictions
Figure 6 shows the relationship between the number of suggestions based on the topic of the email. We can observe that the number of suggestions given per topic is pretty evenly distributed for Gmail, while for outlook the topic resignation edges out a lot more compared to other topics.
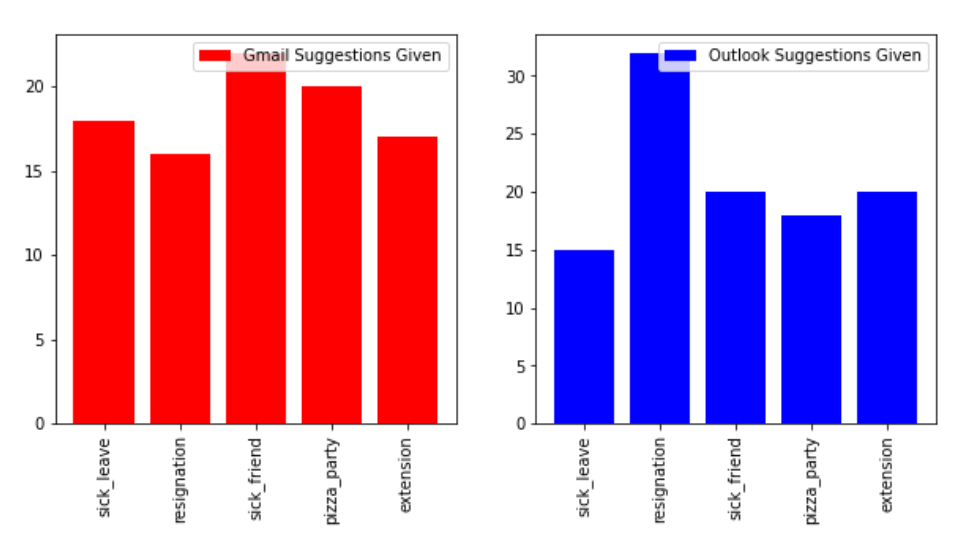
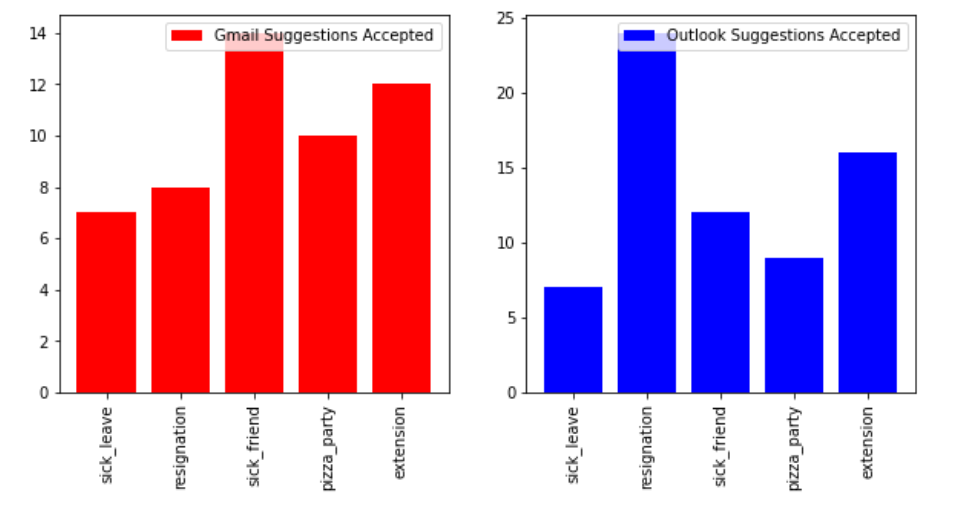
Figure 7 shows the number of suggestions which were accepted. As we can see from the bar chart, the number of suggestions accepted is way less than the number of suggestions given for topics such as emails for sick leave and emails for a pizza party. The number of accepted suggestions is again pretty evenly distributed for Gmail compared to Outlook.
Statistical Tests
To gain valuable insight from the data, we have undertaken various statistical tests to gain valuable insights. Some of the Statistical tests we have undertaken are described below:
T-Test
The t-test determines the significance of differences in group means. It tells you whether the disparities in means were caused by chance. The t-test is typically used when data sets have a normal distribution but the population variance is unknown.
For instance, you could flip a coin 1,000 times and discover that the number of heads follows a normal distribution across all trials. So, while the sample variance can be calculated from this data, the population variance is unknown. Alternatively, a pharmaceutical company may want to test a new cancer drug to see if it improves life expectancy. There is always a control group in an experiment (a group that is given a placebo, or “sugar pill”). So, while the control group may have a life expectancy of +5 years, the new drug group may have a life expectancy of +6 years. The drug appears to be effective. However, it could be a coincidence. Researchers will use a Student’s t-test to see if the results are repeatable across an entire population.
Power Analysis
A power analysis is a calculation used to determine the smallest sample size required for an experiment given a required significance level, statistical power, and effect size. It aids in determining whether a result from an experiment or survey is random or genuine and significant.
Chi-Square Test
The chi-square test is primarily used to determine whether two variables are independent or not. In this context, what does it mean to be independent? It means that the two variables are unrelated. Typically, in social science research, we are looking for factors that are interdependent — education and income, occupation and prestige, and age and voting behaviour. The chi-square can be used to determine whether two variables are dependent or not by ruling out their independence. More broadly, one variable is said to be “not correlated with” or “independent of” the other if an increase in one is not associated with an increase in the other. When two variables are correlated, their values tend to move in the same or opposite direction. Chi-square investigates a particular type of correlation: that between two nominal variables.
Spearman’s Rank Correlation
The Spearman rank correlation test is a non-parametric test for determining the degree of association between two variables. The Spearman rank correlation test makes no assumptions about the data distribution and is the appropriate correlation analysis when the variables are measured on at least ordinal scales.
Research Questions
Is there a statistically significant difference between the suggestions given out by Text Prediction in Gmail and Outlook?
We want to know which system is better at making predictions quantitatively. To confidently say that one system is definitely better than the other in terms of prediction quantity, we performed T-tests and Power analysis to determine how large of a sample size we will need.
T-test
The code block below shows the t-test for 2 related samples. We ideally want to reject the null hypothesis and confidently say that one system is better at giving predictions than the other.
scipy.stats.ttest_rel(data['gmail_given'], data['outlook_given'])
As we can see from the result below, the pvalue is 0.131, which tells us that the difference is not statistically significant enough to reject the null hypothesis.
Ttest_relResult(statistic=-1.5333544998668782, pvalue=0.13136910461185278)
Total number of suggestions given out by Gmail: 378
Total number of suggestions given out by Outlook: 429
Power Analysis
We will be doing power analysis to determine the smallest sample size needed to determine if the result is statistically significant or not. The code block below shows the calculations used by us to calculate the Power Analysis. The out for this code block was **522.23, **which states that we need approximately 522 samples to confidently gauge the difference between Gmail and Outlook in terms of quantitative predictions.
# power analysis for indp ttest
power_analysis = smp.TTestIndPower()
meanDifference = np.mean(data['gmail_given']) - np.mean(data['outlook_given'])
# standardDeviation = np.std(data['gmail_accepted']) - np.std(data['outlook_accepted'])
sigma1 = np.std(data['gmail_given'])
sigma2 = np.std(data['outlook_given'])
n1 = len(data['gmail_given'])
n2 = len(data['outlook_given'])
s_pooled = np.sqrt(((n1–1)*sigma1**2 + (n2–1)*sigma2**2)/(n1 + n2–2))
effect_size = meanDifference/s_pooled
print("Mean Difference: ", meanDifference)
print("Standard Deviation: ", s_pooled)
power_analysis.solve_power(effect_size=effect_size, alpha=0.05, power=0.8, ratio= 1.0, alternative='two-sided')
Is there a statistically significant difference between the suggestions accepted by people when using Text Prediction in Gmail and Outlook?
We want to know which system is better at making predictions qualitatively. To confidently say that one system is definitely better than the other in terms of prediction quality (number of accepted suggestions by subjects), we performed T-tests and Power analysis to determine how large of a sample size we will need.
T-test
The code block below shows the t-test for 2 related samples. We ideally want to reject the null hypothesis and confidently say that one system is better at giving predictions than the other.
scipy.stats.ttest_rel(data['gmail_accepted'], data['outlook_accepted'])
As we can see from the result below, the pvalue is 0.266, which tells us that the difference is not statistically significant enough to reject the null hypothesis.
Ttest_relResult(statistic=-1.122382782836896, pvalue=0.26695610770167605)
Total number of suggestions accepted by Gmail: 270
Total number of suggestions accepted by Outlook: 300
Power Analysis
We will be doing power analysis to determine the smallest sample size needed to determine if the result is statistically significant or not. The code block below shows the calculations used by us to calculate the Power Analysis. The output for this code block was **679, **which states that we need approximately 679 samples to confidently gauge the difference between Gmail and Outlook in terms of quantitative predictions.
power_analysis = smp.TTestIndPower()
meanDifference = np.mean(data['gmail_given']) - np.mean(data['outlook_given'])
# standardDeviation = np.std(data['gmail_accepted']) - np.std(data['outlook_accepted'])
sigma1 = np.std(data['gmail_given'])
sigma2 = np.std(data['outlook_given'])
n1 = len(data['gmail_given'])
n2 = len(data['outlook_given'])
s_pooled = np.sqrt(((n1–1)*sigma1**2 + (n2–1)*sigma2**2)/(n1 + n2–2))
effect_size = meanDifference/s_pooled
print("Mean Difference: ", meanDifference)
print("Standard Deviation: ", s_pooled)
power_analysis.solve_power(effect_size=effect_size, alpha=0.05, power=0.8, ratio= 1.0, alternative='two-sided')
Can one system predict email subjects better than the other?
We want to know if a particular AI system can predict a subject better than the other in a statistically significant way. We will be using the Chi-squared test for this purpose. A chi-square test of independence is used when you have two categorical variables.
Chi-squared test
The code below shows the chi-squared test conducted for categorical variables in the table Gmail subject and outlook subject.
chi2, p, dof, ex = scipy.stats.chi2_contingency(pd.crosstab(data['gmail_subject'], data['outlook_subject']))
As we can see from the result below, the pvalue is 0.000321, which means we can reject the null hypothesis and state with confidence that Gmail is better at predicting subjects than Outlook.
Chi2: 12.937074319982866
P: 0.00032213807888300925
Degrees of freedom: 1
Gmail predicted the subject correctly: 23
Outlook predicted the subject correctly: 10
Does age play a factor in preferring one system over another?
We will be making use of Spearman rank correlation to determine the degree of correlation between age and the preference for one system over another.
Spearman’s Correlation
The code block below shows the code to calculate the correlation between age and liker_gmail/likert_outlook columns.
# Does age play a role in preferring one over the other?
gmail = scipy.stats.spearmanr(data['age'], data['likert_gmail'])
outlook = scipy.stats.spearmanr(data['age'], data['likert_outlook'])
print("Gmail: ", gmail)
print("Outlook: ", outlook)
# Print median age of participants
print("Median age: ", data['age'].median())
# Standard deviation of age
print("Standard deviation of age: ", data['age'].std())
# Standard deviation of gmail likert
print("Standard deviation of gmail likert: ", data['likert_gmail'].std())
There is no variation in age column so its standard deviation is equal to 0 which will result in zero division in the spearmanr() function, thereby returning a NaN. Mathematically speaking, the Spearman correlation coefficient is undefined when the standard deviation in one of the two lists is equal to zero (where all instances of the random variable take the exact same value). Therefore, we cannot determine if age affects preference for one system over another mostly due to not having a more diverse dataset in terms of age.
Gmail: SpearmanrResult(correlation=nan, pvalue=nan)
Outlook: SpearmanrResult(correlation=nan, pvalue=nan)
Median age: 25.0
Standard deviation: 3.0791597051461816
Standard deviation of gmail likert: 1.0915830451663864
Does gender play a factor in preferring one system over another?
We will be making use of Spearman rank correlation to determine the degree of correlation between gender and the preference for one system over another. We have 65.4% male and 34.6% Female participants, which tells us that our dataset is biased towards male participants.
Spearman’s Correlation
The code block below shows the code to calculate the correlation between gender and liker_gmail/likert_outlook columns.
gmail = scipy.stats.spearmanr(data['gender'], data['likert_gmail'])
outlook = scipy.stats.spearmanr(data['gender'], data['likert_outlook'])
print("Gmail: ", gmail)
print("Outlook: ", outlook)
As we can see from the correlation value and the pvalue, the pvalue is less, but it’s still not low enough to reject the null hypothesis together for both Gmail and Outlook. Thus, we cannot confidently say that the correlation is due to chance or if it’s statistically significant enough to reach a definite conclusion.
Gmail: SpearmanrResult(correlation=0.21709552678566083, pvalue=0.12211795072566538)
Outlook: SpearmanrResult(correlation=-0.15959187897073357, pvalue=0.2584259458736071)
Is there a correlation between the preference for one system and the number of suggestions given/accepted in emails?
In order to find the correlation between the number of suggestions given/accepted in the email to the final Likert scale score, we will be using spearman’s rank correlation. We will also be subtracting the number of suggestions given from the number of suggestions accepted in order to perform the comparison based on performance vs preference for a particular system.
Spearman’s Correlation
The code block below shows the code to calculate the correlation between the performance and preference of Gmail and Outlook.
gmail = scipy.stats.spearmanr(data['gmail_given'] - data['gmail_accepted'], data['likert_gmail'])
outlook = scipy.stats.spearmanr(data['outlook_given'] - data['outlook_accepted'], data['likert_outlook'])
print("Gmail: ", gmail)
print("Outlook: ", outlook)
As we can see from the correlation value and the pvalue, the pvalue is not statistically significant enough to reject the null hypothesis. Since it’s a small dataset we can infer that chance and no relationship is a plausible explanation.
Gmail: SpearmanrResult(correlation=0.053710997762431774, pvalue=0.7053017569618225)
Outlook: SpearmanrResult(correlation=0.058154963190009824, pvalue=0.6821624674078564)
Which system is preferred as the better system overall?
Based on the Likert test undertaken by our subjects, we want to statistically say that one system is better compared to the other system. We have also done some preprocessing to convert Likert categorical values to numerical values in order to better gain insightful observations.
# Convert likert scale to numerical values
data = data.replace({"Very Satisfied": 2, "Satisfied": 1, "Neutral": 0, "Unsatisfied": -1, "Very Unsatisfied": -2})
T-test
The code block below shows the t-test for gmail_accepted vs outlook_accepted. We ideally want to reject the null hypothesis and confidently say that one system is better at giving predictions than the other.
# T-test for likert scale analysis
test = scipy.stats.ttest_rel(data['likert_gmail'], data['likert_outlook'])
# Print total value of likert scale
print(test)
print("Total value of likert scale for Gmail: ", data['likert_gmail'].sum())
print("Total value of likert scale for Outlook: ", data['likert_outlook'].sum())
As we can see from the result below, the pvalue is 0.5824, which tells us that the difference is not statistically significant enough to reject the null hypothesis. While the Likert scale numerical value for Gmail edges ahead of Outlook (Gmail 44 to Outlook 38), we cannot determine which system is better overall.
Ttest_relResult(statistic=0.5533571505734132, pvalue=0.582436712228309)
Total value of likert scale for Gmail: 44
Total value of likert scale for Outlook: 38
Power Analysis
We will be doing power analysis to determine the smallest sample size needed to determine if the result is statistically significant or not. The code block below shows the calculations used by us to calculate the Power Analysis. The power analysis calculated was **1350, **which means that we need approximately 1350 data points to statistically say which system is the preferred system.
power_analysis = smp.TTestIndPower()
meanDifference = np.mean(data['likert_gmail']) - np.mean(data['likert_outlook'])
sigma1 = np.std(data['likert_gmail'])
sigma2 = np.std(data['likert_outlook'])
n1 = len(data['likert_gmail'])
n2 = len(data['likert_outlook'])
s_pooled = np.sqrt(((n1–1)*sigma1**2 + (n2–1)*sigma2**2)/(n1 + n2–2))
power_analysis.solve_power(effect_size=meanDifference/s_pooled, alpha=0.05, power=0.8, ratio= 1.0, alternative='two-sided')
Limitations
These are basically the flaws in a research design that could have an impact on the findings and conclusions of the study. While evaluating the text prediction systems, we came across multiple challenges that affected the study.
-
The quality of the data collected was a major limitation we came across during the evaluation. Predictions will work depending on the quality of words used to compose the email which varied significantly among participants. As a result, the systems did not accurately suggest phrases or sentences for some emails.
-
The number of participants who took part in the survey was also a limitation which affected the evaluation. A bigger dataset would have allowed for a deeper analysis of the experiment and provided better statistical measurements. We were able to recruit only 54 subjects for our study due to time constraints.
-
Another limitation which impacted was the word limit we chose for emails. The email should be long enough for the system to clearly understand the context and start predicting. Our average word limit for the experiment was 80–100 which is good enough but the system might be able to predict more accurately with a higher word count.
-
The predictions are dependent on the scenarios as well. In this particular experiment, the number of scenarios for creating emails was limited to 5 which affected the evaluation of the system. The systems predict better in some scenarios and worse in some which couldn’t be fully explored with the limited topics. We limited the number to 5 due to the time constraint and less number of participants that were willing to take part.
Future Work
A series of tests and the process of collecting questionnaires expanded our thinking, and we found that there are many aspects of the sentence completion system worthy to test in the future.
-
First and foremost, to get more convincing results, it is necessary to extend the test period to increase the number of survey samples. For the email autocomplete function, we have many reveries, and also need a larger sample size to support further research. To test a hypothesis, it needs to be based on a larger sample size. Therefore, in future, we want to expand the sample size, get more data, and calculate more accurate results.
-
Secondly, some of our data sources come from people whose native language is English, and some people from non-English-speaking countries. We found that the style of emails written by them looks very different, so we are interested in further exploring the differences between the two groups of people when they write. How often auto-completion is triggered will vary.
-
In addition, we learned that Outlook supports Irish English, British English etc. So we’re curious whether different dialects will compromise smart completion in Outlook and Gmail. So future research may use dialect to write emails as test cases for further testing.
-
On the intuitive side, can we predict the number of autocomplete based on the length of the email? Is there a function between the number of prediction points and the word count of the email? In the future, we can look for emails of different lengths to test the relationship between the two.
-
Last but not least, in this experiment we focused on whether autocompletion works, and to what extent this function works. But during the test, we found that some test cases performed well in Outlook but mediocre in Gmail. However, some samples perform very well in Gmail and are not satisfactory in Outlook. At the same time, we also found that entering the same sentence into Outlook and Gmail respectively was almost completely different. The subject of the email is different, and Gmail behaves differently under different topics for the same sentence, and we try to find out which topics and unfamiliar areas they are more familiar with. In this test, we limited the content of the email to 5 topics, which can get the data faster and improve the validity of the data, but to a certain extent, it limits the richness of the scene. In the future, we will provide more options for subjects to think more divergently and allow for self-written topics to compose emails. Then, according to the topic of the email (such as activity notification scene, daily communication scene, application scenario, inquiry and suggestion scene, etc.), explore how the two systems perform in different scenarios, to determine which scenario is more suitable for which system.
Conclusion
A survey was conducted to compare the text prediction systems of Gmail and Outlook, with 54 people taking part. The t-test, spearsons rank correlation, chi-squared test, and power analysis were used to answer our initial hypothesis in relation to the research questions. We ran statistical analyses on all of the research questions, and we couldn’t reject the null hypothesis on the majority of them. The prediction of the subject for Gmail is better than Outlook, as demonstrated by the chi-squared test.
Power analyses were also performed for research questions concerning quantitative and qualitative predictions of Gmail and Outlook, yielding values of 522 and 679, respectively. We can’t say with certainty that one system is better than the other in terms of text prediction quantity or quality because we couldn’t statistically disprove the null hypothesis.
The Likert scale was used to measure user preference for a specific system, and after summing the numerical values associated with the scale, we assigned Gmail a score of 44 and Outlook a score of 38. A t-test on the Likert value of Gmail and Outlook did not yield a statistically significant pvalue low enough to reject the null hypothesis. As a result, based on the data available, we cannot say whether one system is preferable to the other.
References
-
https://www.tibco.com/reference-center/what-is-power-analysis
-
Barrett-Gonzalez, R., Schumacher, L., & Weheba, G. (n.d.). JOURNAL OF MANAGEMENT AND ENGINEERING INTEGRATION editor-in-chief. Journalmei.com. Retrieved November 20, 2022, from https://www.journalmei.com/_files/ugd/f76c8e_473a1e3ce4e344fda99a5d6d2041276e.pdf
-
https://www.statisticshowto.com/probability-and-statistics/t-test/
-
Chen, M. X., Lee, B. N., Bansal, G., Cao, Y., Zhang, S., Lu, J., Tsay, J., Wang, Y., Dai, A. M., Chen, Z., Sohn, T., & Wu, Y. (2019). Gmail smart compose: Real-time assisted writing. Proceedings of the 25th ACM SIGKDD International Conference on Knowledge Discovery & Data Mining.
Related Posts

The Ultimate Review of GitHub Copilot for Language Translation
GitHub Copilot & OpenAI Codex OpenAI Codex is a descendant of GPT-3, and its training data includes both natural language and billions of lines of source code from publicly available sources, such as GitHub repositories.
Read more
Text Classification in NLP using Cross Validation and BERT
In natural language processing, text categorization tasks are common (NLP). Depending on the data they are provided, different classifiers may perform better or worse (eg.
Read more
A Deep Dive into Reinforcement Learning: Q-Learning and Deep Q-Learning on a 10x10 FrozenLake Environment
Reinforcement Learning is a machine learning method in which an algorithm makes decisions and takes actions within a given environment and learns what appropriate decisions to make through trial-and-error actions.
Read more